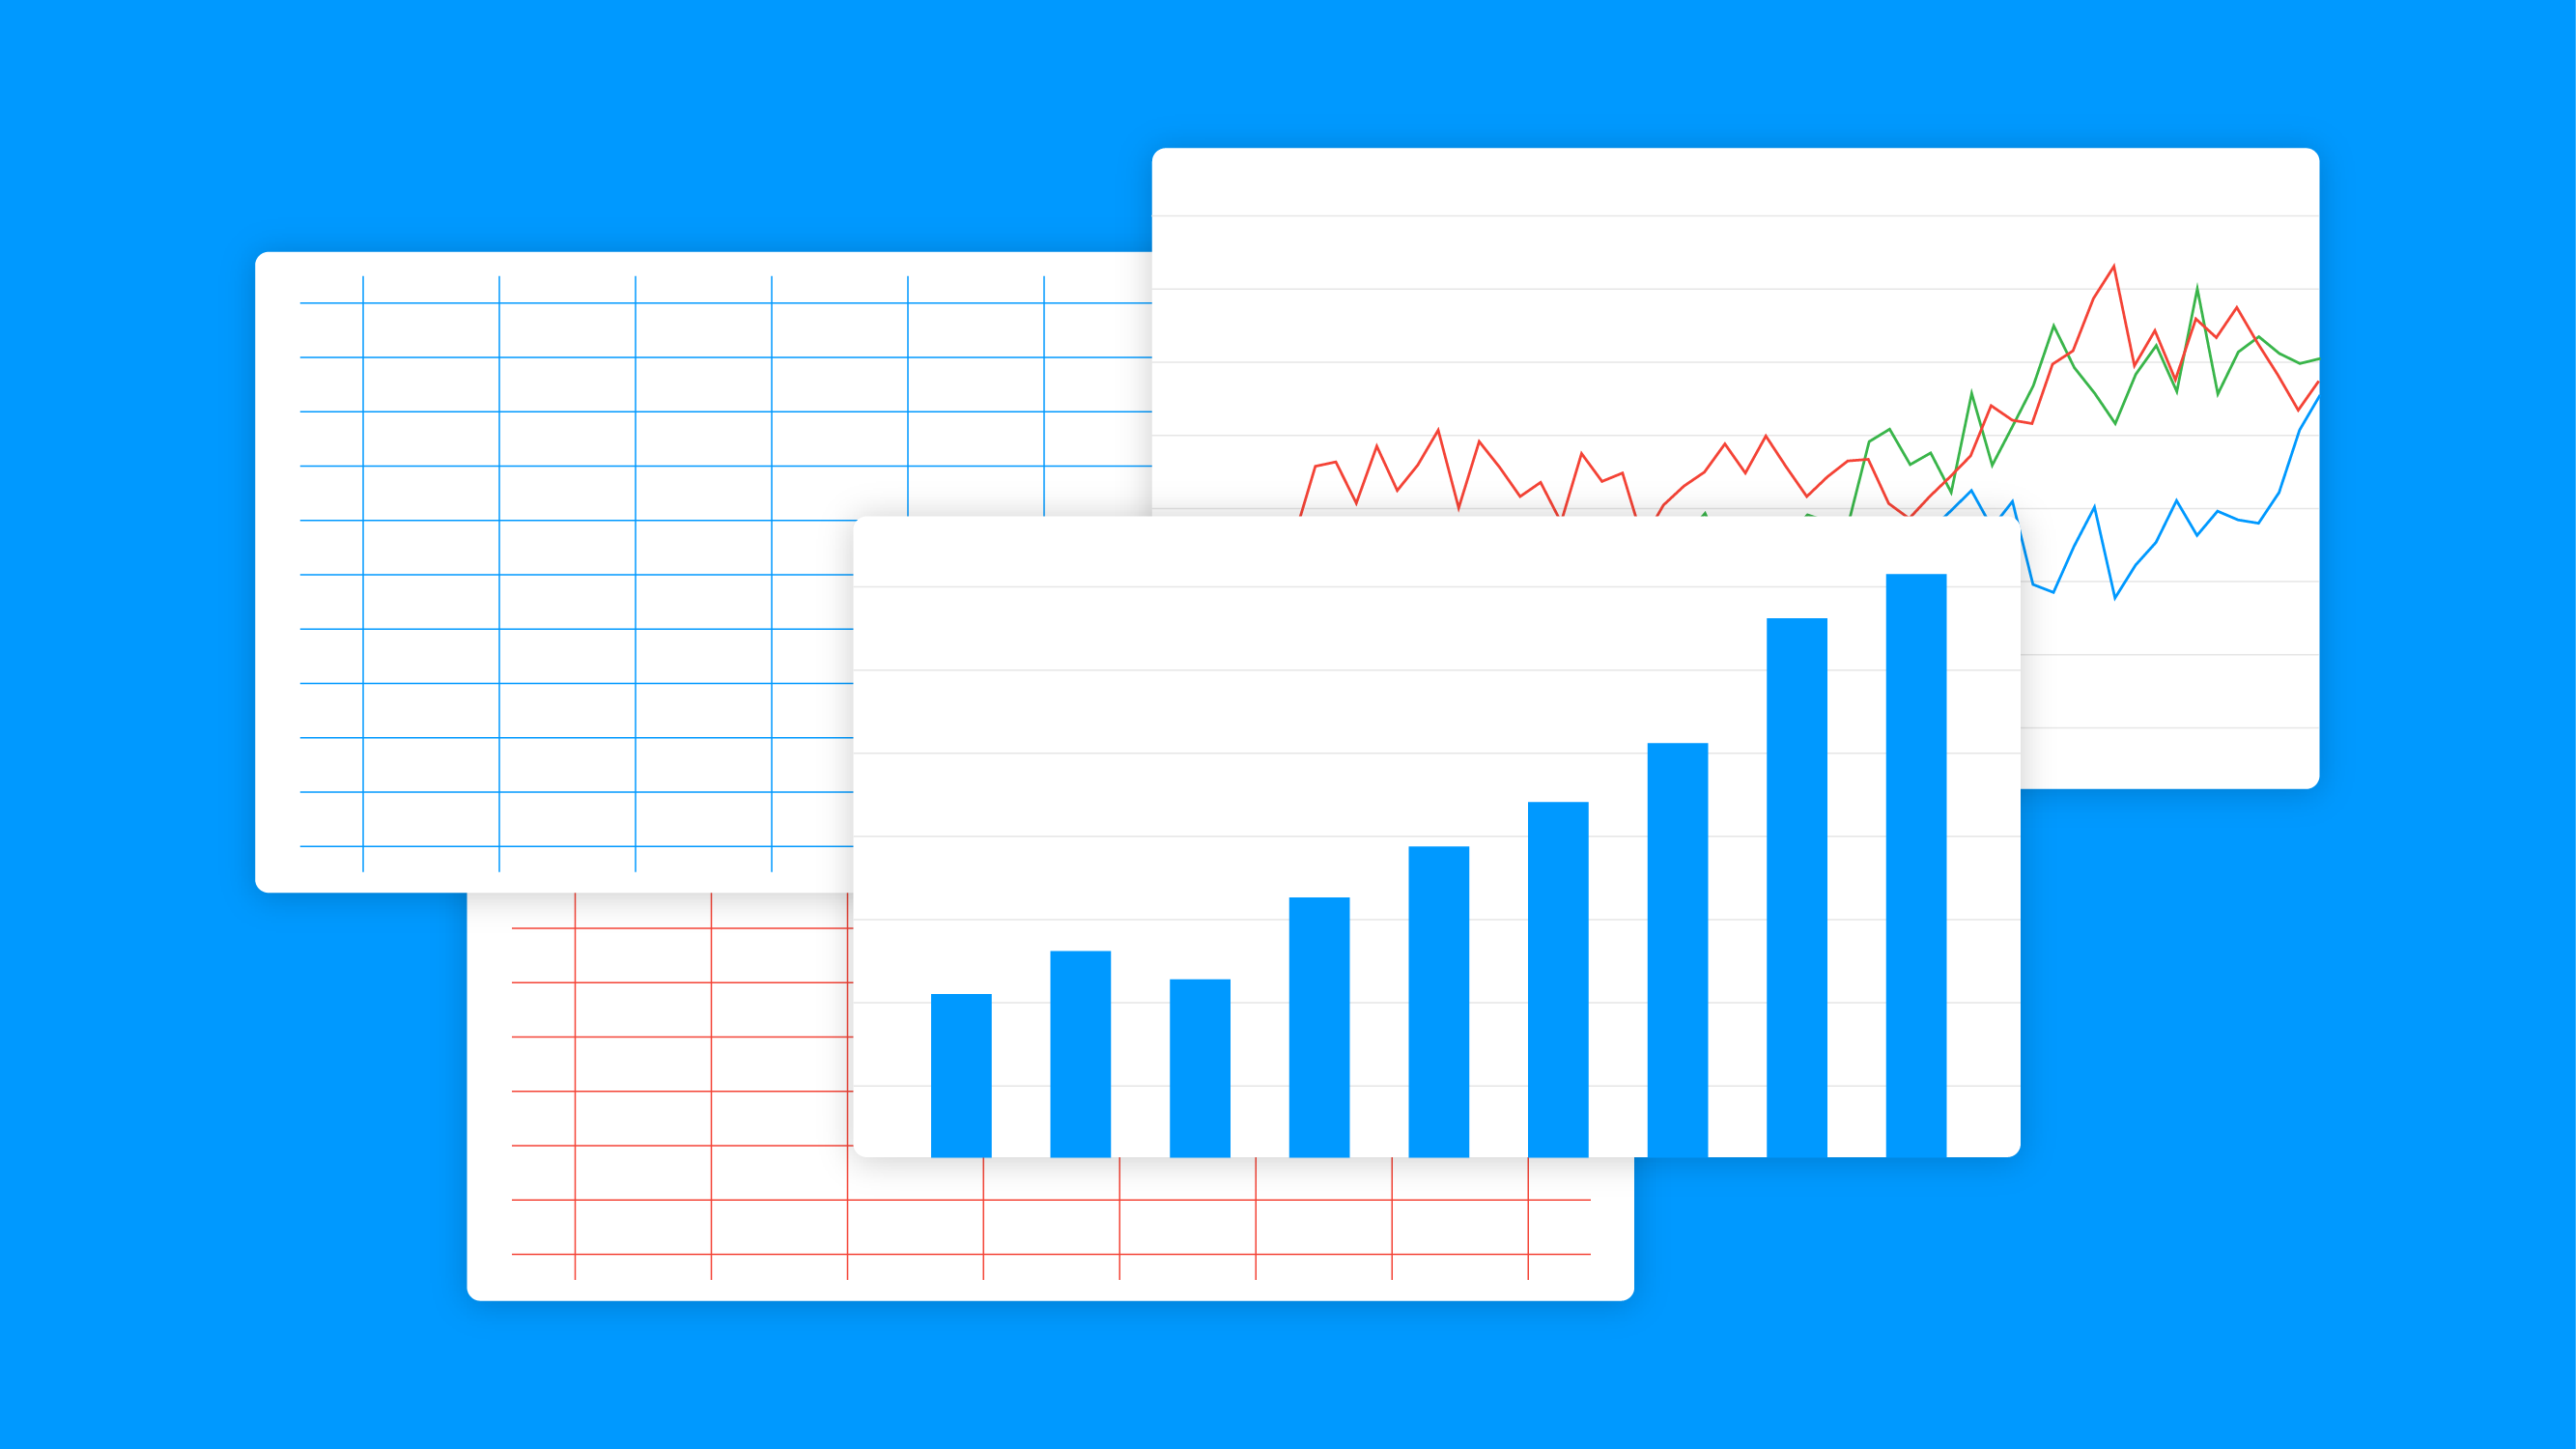
Ever asked ‘Why is campaign reporting so unnecessarily complicated and time-consuming?’ *Sigh* Same.
Most reporting solutions need to provide one-size-fits-all metrics to serve thousands of client needs. While analytics software can often provide customization options, most ad platforms don’t offer the same. Advertisers have long griped about the limitations of Facebook’s KPI and attribution options. Worse still, many advertisers distrust Facebook’s measurement accuracy, worrying that Facebook’s attribution is skewed to reflect more positive results.
As a result, many marketers resort to customized tracking with third-party analytics platforms or exporting raw campaign data to perform calculations in a cumbersome Excel spreadsheet. Both options require significant manual effort—additional effort that could easily be automated through a better solution.

Customize your dashboard with the KPIs that matter.
Most companies have specific metric formulas that more accurately reflect what true ROI looks like based on their business. While you can get a top-level sense of whether a campaign is “good” or “bad” from Facebook’s basic offering, adding your unique metrics into your reporting dashboard can give you deeper insight, allowing you to determine whether your campaigns are hitting your goals and providing an incremental return. Better reporting = smarter marketing decisions.
Here’s some custom metrics we’ve created:
- Total ROAS = (ONLINE REVENUE + IN-STORE REVENUE + APP REVENUE) / SPEND
- Profit = ((ONLINE REVENUE + IN-STORE REVENUE + APP REVENUE) * PROFIT MARGIN) - SPEND
- Conversion Rate = (ONLINE PURCHASES +IN-STORE PURCHASES + APP PURCHASES) / CLICKS
- Cart Conversion Rate = (ONLINE PURCHASES + APP PURCHASES) / (ONLINE ADDS TO CART + APP ADDS TO CART)
- % Budget Remaining = (BUDGET - SPEND) / BUDGET
- % Cost of Sale = SPEND / (ONLINE REVENUE + IN-STORE REVENUE + APP REVENUE)
- Average Order Value = ONLINE REVENUE / ONLINE PURCHASES (Try separating by channel to see where you get your strongest AOV!)
Integrate third-party data for better accuracy.
Custom metrics are one step you can take for automated, transparent reporting. For advertisers using their third-party analytics platform like Google Analytics, you can also integrate to build reports based on the data you trust. Combined with custom metrics, third-party integrations remove all the manual work from campaign reporting. Third party tracking is delivered in real time and can be combined with Facebook’s native tracking.
Export for shareable, meeting-ready insights.
Campaign reports can be exported for shareability. You can still choose to export raw data or utilize our flexible, visual graphs to demonstrate the most crucial insights. Either way, you’ll have more time to focus on optimizing your campaigns. And you should receive high praise, both for the stellar reports and for the increased efficiencies that came with it.
Ready to get started? Request a demo and we’ll walk you through our automated campaign reporting capabilities.


